HOW TO CREATE A
POPULATION PYRAMID
Step-by-step guide to create a population pyramid:
1. Gather all needed information. You should have the population of the country by age groups and for different genders. The age groups could be in a gradual increase of 4, for example 0-4, 5-9, 10-14, 15-19 and so on.
2. Draw a line in the middle of where you want your graph to be, draw the Y-axis and X-axis line.
3. Label the Y-axis with the age groups and the X-axis with the population (in which units? Millions or thousands).
4. Look at the information and input the data into the population pyramid for both genders, males on one side and females on the other. Make sure the different genders are coloured in a different colours and make a legend for it beside the population pyramid.
5. Finally, remember to add the title to let the viewer know what the population pyramid is about. For example, "Canada's Population Pyramid in 2015".
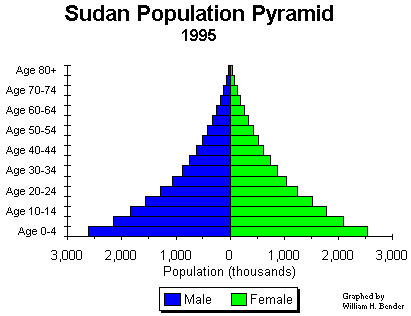
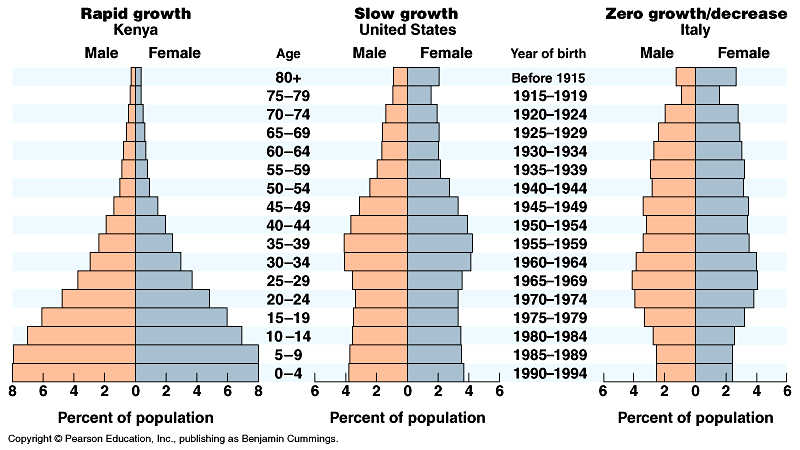
Examples of Population Pyramids:


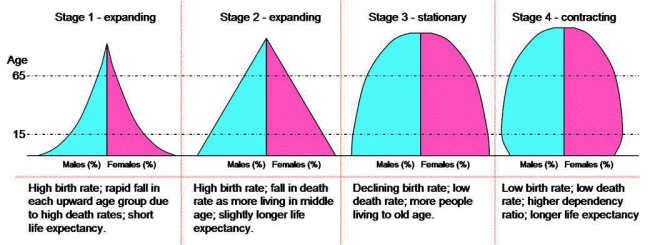
Stages of a Population Pyramid & The Patterns of Population Change:

